Intro
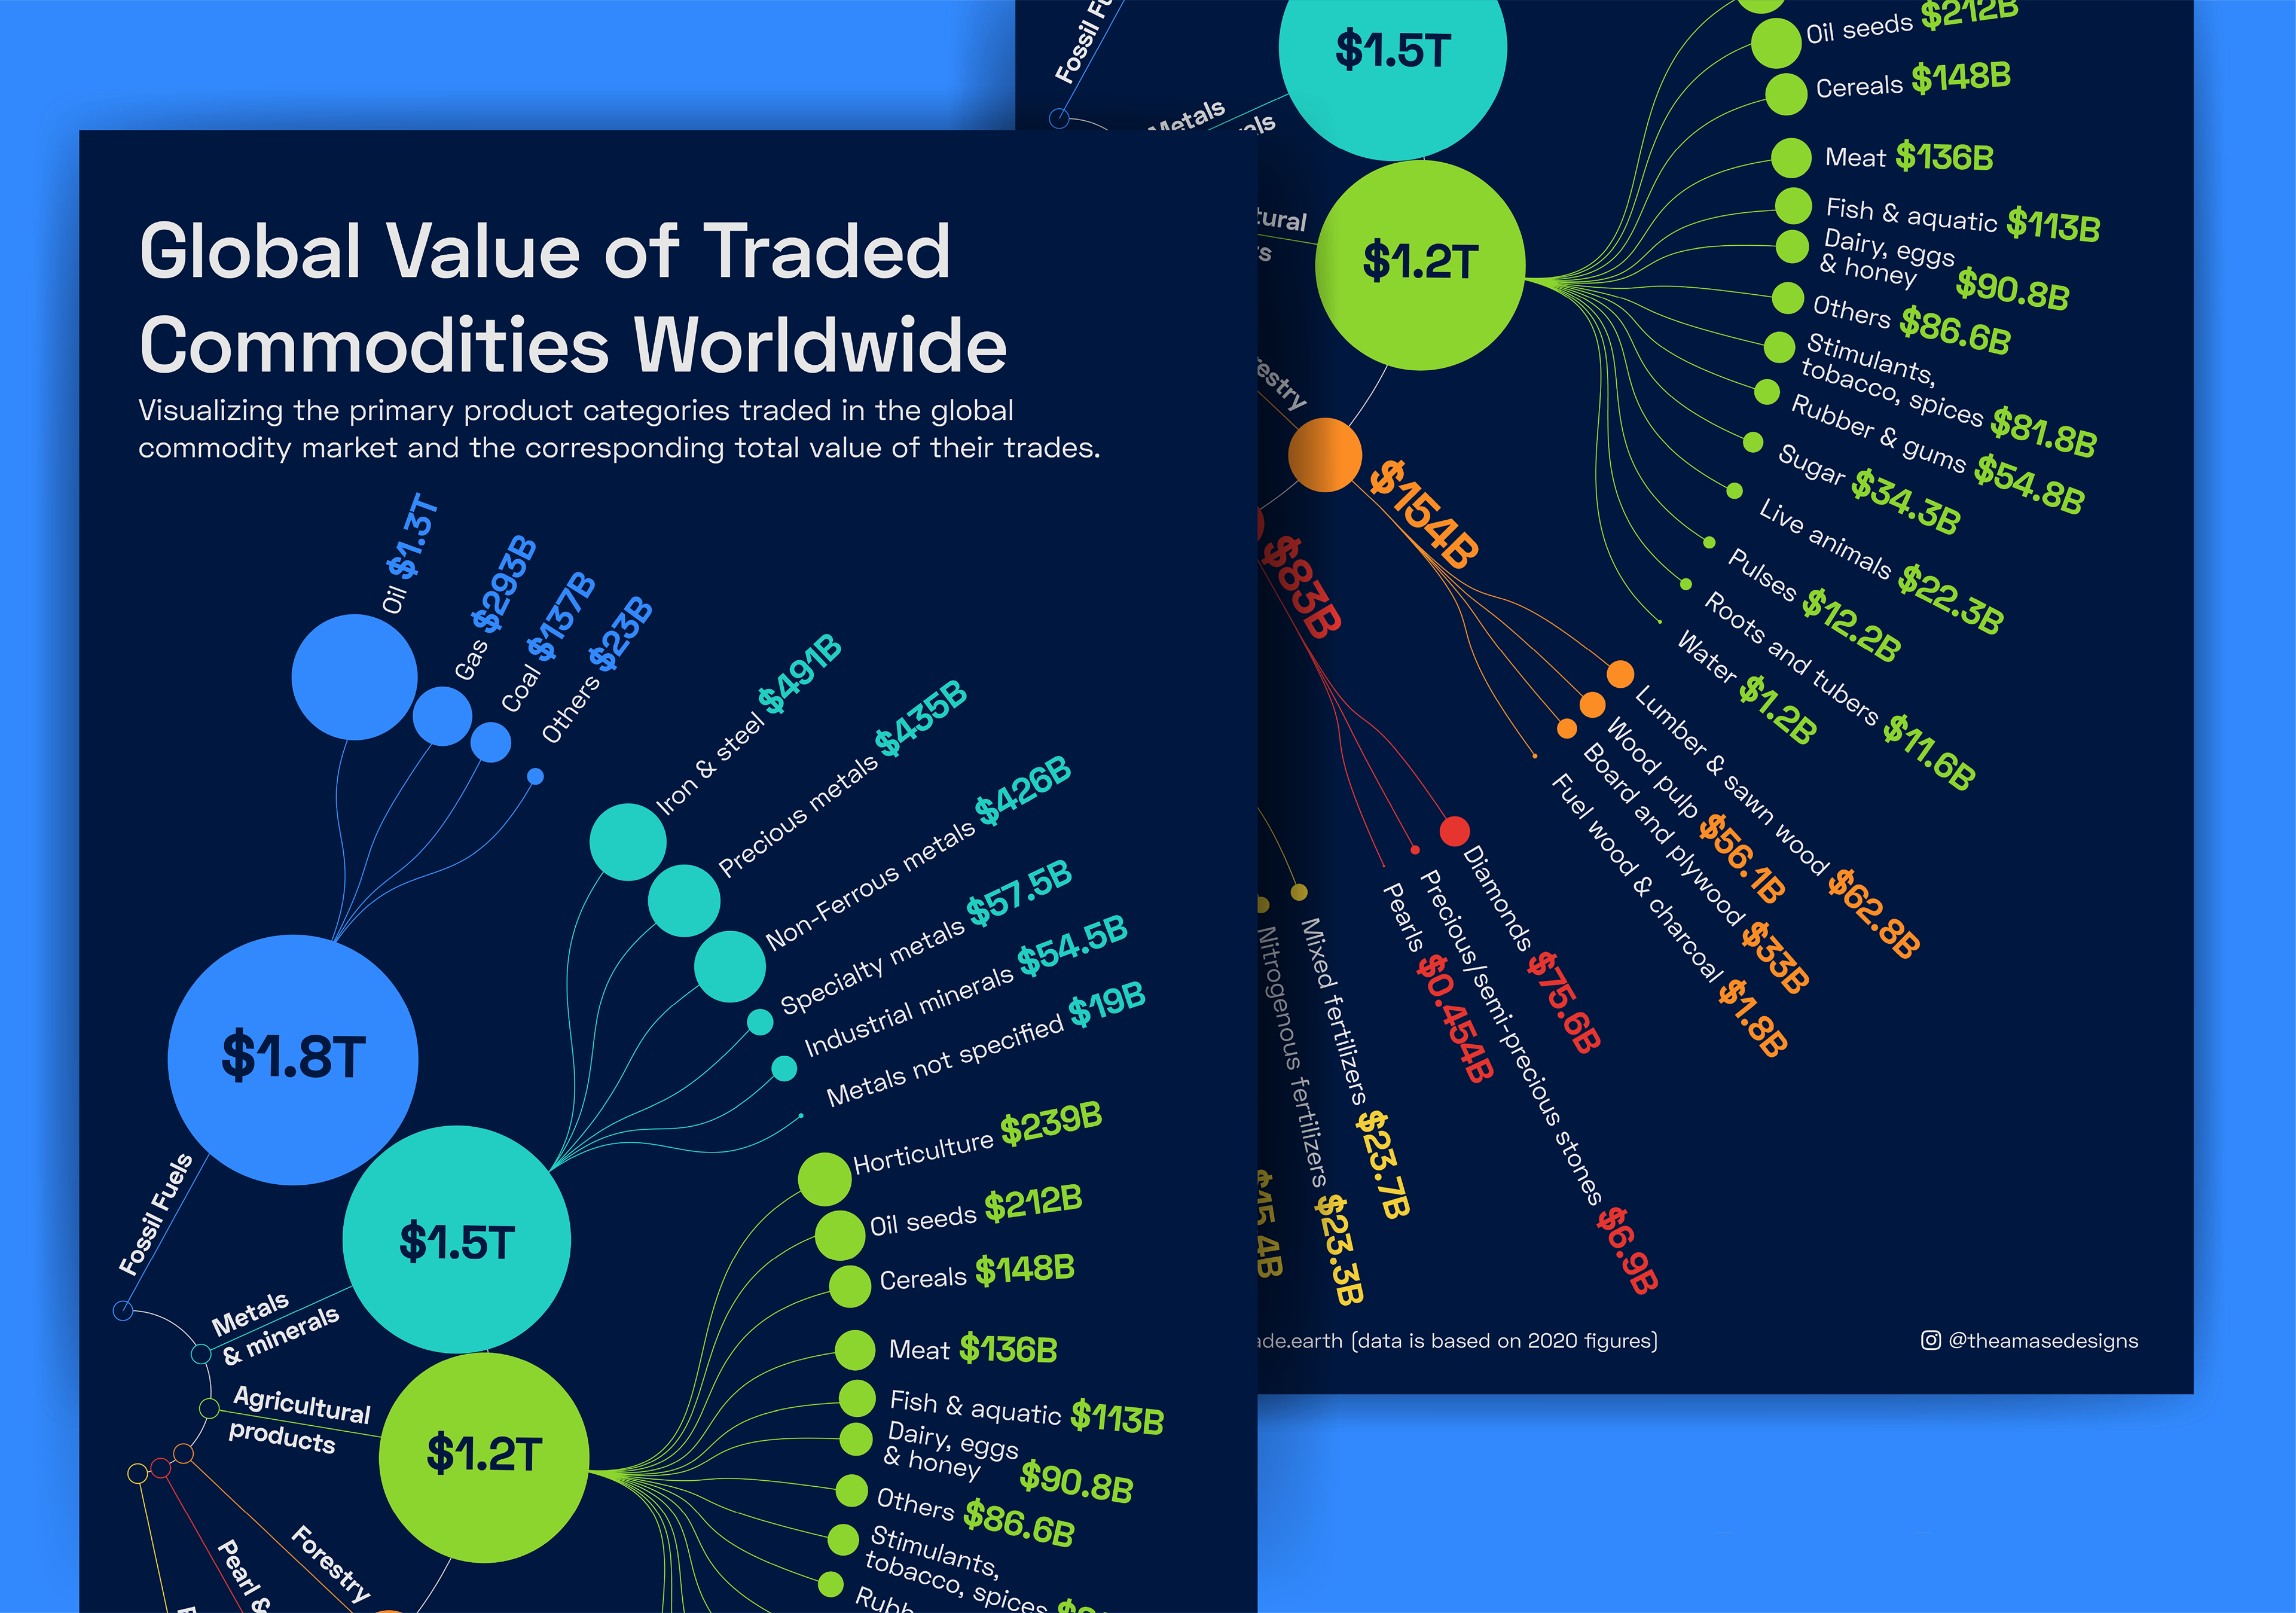
This was my first entry for the Visual Capitalist Creator Program Challenge on international trade. For this project, I utilized the provided dataset and it required some time to settle on the story I wanted to convey. Ultimately, I chose to focus on visualizing the total trade value of primary commodities, with the aim to provide a unique perspective on this aspect of global trade.
Process
During the process of working with the dataset, I had to get different datasets and joined them in Google Sheets to truly appreciate and explore the insights. I encountered some intriguing findings that caught my attention; One fascinating discovery was the global trade value of water, which amounted to an astonishing $1.2 billion. This finding sparked my curiosity, as water is something I have always considered abundantly available everywhere. However, being from a coastal state, this realization gave me a unique perspective and made it even more captivating.
Outcome
This entry was shortlisted for the competition and published on the Visual Capitalist creator program shortlist. This was a great end enriching experience for me. I created the piece so people could have the opportunity to gain insights into the total trade value of primary commodities.